


By the Numbers
Up-in-coupon Ginnie Mae offers best projected returns
Brian Landy, CFA | December 9, 2022
This material is a Marketing Communication and does not constitute Independent Investment Research.
Option-adjusted spreads for higher coupon conventional mortgage-backed securities tightened significantly after last month’s benign inflation report. Despite the tightening, moving up-in-coupon is still likely to offer higher 1-year total returns across a wide variety of interest-rate scenarios compared to a portfolio of Treasury debt. And investors can boost returns further with Ginnie Mae MBS instead of conventional MBS. Ginnie OASs tightened less than conventional OASs, which helps compensate investors for the greater prepayment risk and lower convexity of Ginnie Mae mortgage-backed securities.
A 30-year conventional pass-through easily beats the returns of a portfolio of 2-year and 10-year Treasury debt that matches the duration and market value of the mortgage-backed security (Exhibit 1). The amount of outperformance increases steadily when moving to higher coupons, which helps compensate investors for the greater prepayment risk in those coupons.
Exhibit 1: Projected returns in 30-year conventional pass-through net of returns in Treasury debt
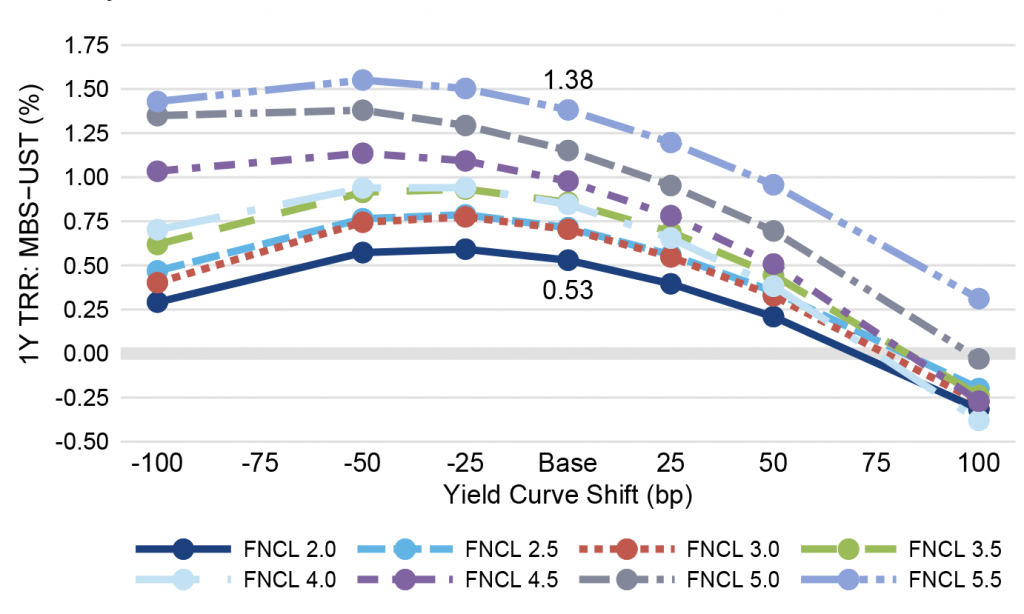
Note: Data shows the performance in 30-year TBA MBS net of returns in a duration- and proceeds-matched portfolio of 2- and 10-year Treasury notes. All market levels as of COB 12/7/2022. Total returns in all assets assume a linear parallel shift in rates and constant OAS repricing at horizon, reinvestment in 1-month SOFR. Returns do not account for dollar rolls. Calculation details in the appendix to this note.
Source: Yield Book, Amherst Pierpont Securities.
A pattern of returns where MBS performance against Treasury debt peaks in a base case and then fades in the wings is typical. Price performance in negatively convex MBS is worse than performance in positively convex Treasury debt as rates shift. And big shifts in rates eventually offset the MBS spread and income advantage. The only difference currently is the strong initial outperformance of MBS and its ability to survive bigger shifts in rates. The pass-throughs outperform Treasuries unless interest rates increase at least 75 bp.
Although Yield Book’s model assigns similar convexities to FNCL 2.0%s and FNCL 5.5%s, the lower coupon MBS has substantially larger convexity gap with its matching Treasury portfolio than the higher coupon MBS. This is because the lower coupon MBS has a longer duration, and its matching Treasury portfolio is heavily weighted towards the more convex 10-year Treasury bond (Exhibit 2a). The 2.0% pass-through has a convexity of -0.64, but that becomes -1.25 after hedging with 2-year and 10-year Treasuries. The FNCL 5.5% is a shorter duration security and more comparable to the 2-year Treasury (Exhibit 2b). Its convexity is -0.67, but only drops to -0.72 after hedging.
Exhibit 2a: FNCL 2.0% vs. Treasury debt.
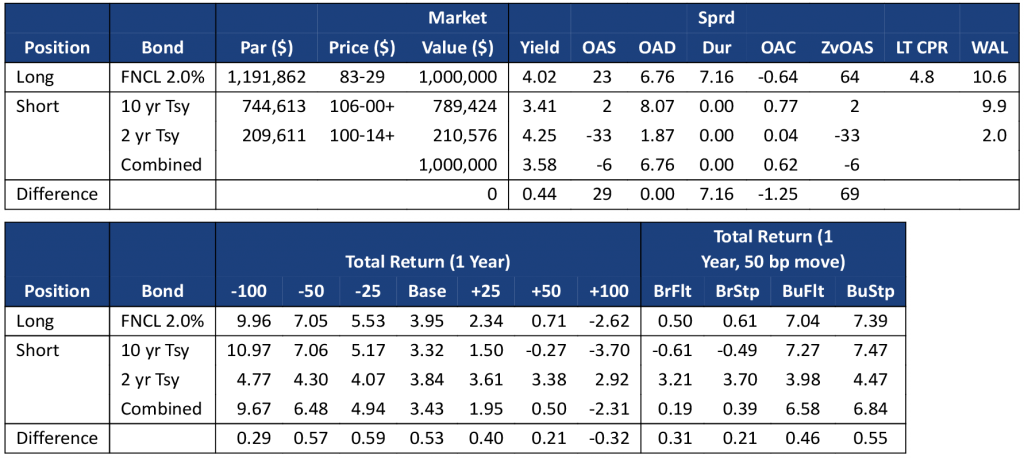
All market levels as of COB 12/7/2022. Total returns in all assets assume a linear parallel shift in rates and constant OAS repricing at horizon, reinvestment in 1-month SOFR. Returns do not account for dollar rolls.
Source: Yield Book, Amherst Pierpont Securities.
Exhibit 2b: FNCL 5.5% vs. Treasury debt.
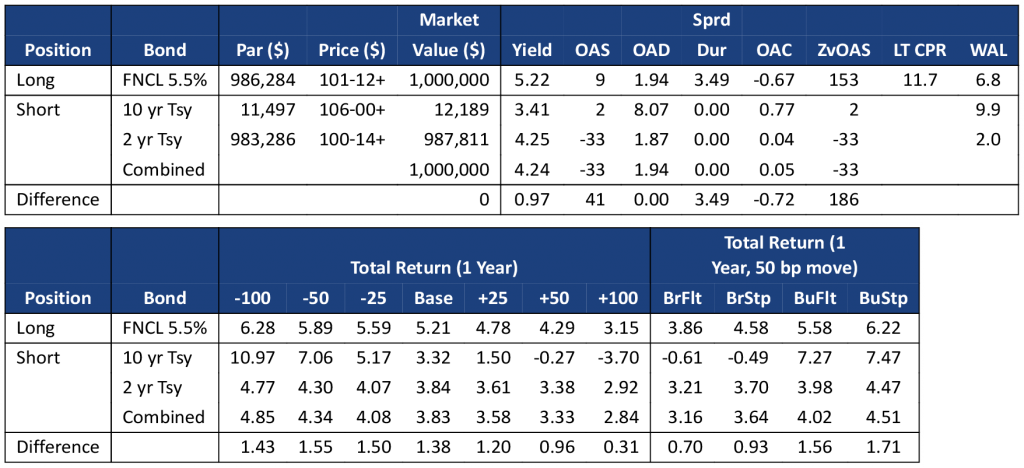
All market levels as of COB 12/7/2022. Total returns in all assets assume a linear parallel shift in rates and constant OAS repricing at horizon, reinvestment in 1-month SOFR. Returns do not account for dollar rolls.
Source: Yield Book, Amherst Pierpont Securities.
Higher coupon mortgage-backed securities offer higher base-case returns and higher convexity after hedging duration. Moving up-in-coupon also reduces the exposure to changes in mortgage spreads. Although spreads tightened after the inflation report in early November, projected MBS supply should stay robust in 2023 from a combination of new origination and Fed MBS portfolio run-off. And if the Fed ever chooses to sell MBS outright, most of its holdings are in FNCL 2.0%s through FNCL 3.0%s, so those coupons are likely to be more affected.
Turn to Ginnie Mae pass-throughs for even higher returns
Investors may be able to enhance returns at higher coupons using Ginnie Mae MBS instead of conventional MBS (Exhibit 3a). For example, the G2SF 5.5% security returns 1.81% in the base case net of Treasury returns, while the conventional MBS is only projected to return 1.38%.
The return advantage persists across rate scenarios for most coupons (Exhibit 3b). Each point represents the difference between the net total return of a Ginnie Mae security minus the net total return of the conventional security. Ginnie Mae TBAs outperform conventional TBAs across all the displayed rate scenarios in 4% and higher coupons, as well as in the 3.0% coupon. Performance of the 3.5% coupon is relatively similar across the two security types, while Ginnie Mae securities underperform in 2.0%s and 2.5%s.
Exhibit 3a: Projected returns in 30-year Ginnie Mae pass-through net of returns in Treasury debt
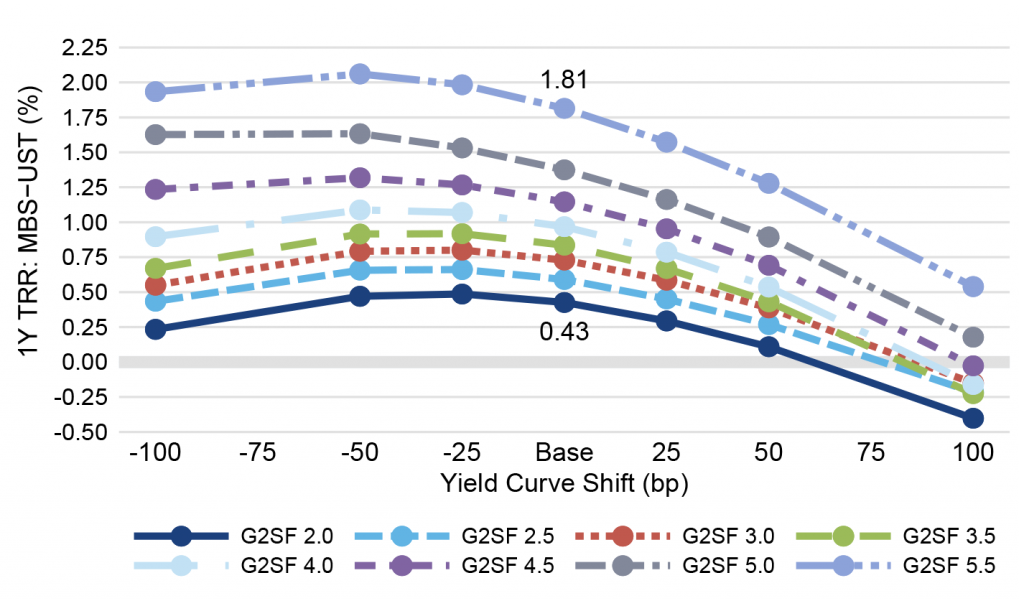
Note: Data shows the performance in 30-year TBA MBS net of returns in a duration- and proceeds-matched portfolio of 2- and 10-year Treasury notes. All market levels as of COB 12/7/2022. Total returns in all assets assume a linear parallel shift in rates and constant OAS repricing at horizon, reinvestment in 1-month SOFR. Returns do not account for dollar rolls. Calculation details in the appendix to this note.
Source: Yield Book, Amherst Pierpont Securities.
Exhibit 3b: Ginnie Mae outperform conventional returns at higher coupons
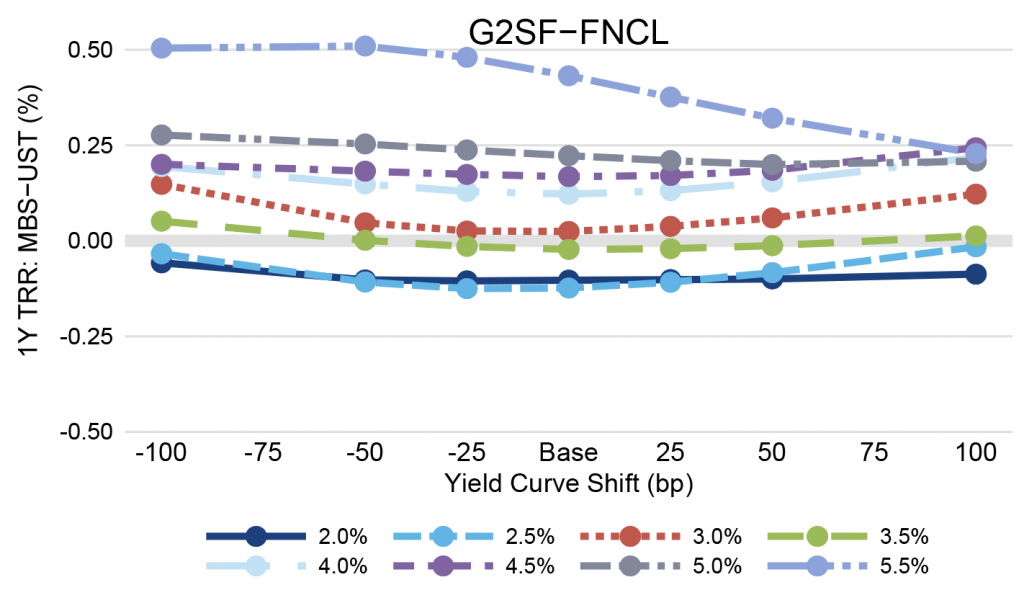
Data shows the difference between the net one-year total returns of conventional and Ginnie Mae TBA MBS.
Source: Yield Book, Amherst Pierpont Securities.
Many of the Ginnie Mae securities, after hedging for duration, are slightly more convex than their conventional counterparts. Only the G2SF 5.5% is less convex than conventional MBS, but it offers the most outperformance across all but the highest interest rate scenario. This coupon is most exposed to refinance risk should mortgage rates continue to fall, because VA loans typically refinance faster than other loan types. It also appears likely that the FHA will lower mortgage insurance premiums sometime next year, which would boost prepayment speeds. That would lower returns on mortgage-backed securities priced above par. However, the FHA is likely to make only a modest reduction to premiums so the effect on value will be muted compared to the premium reduction in 2015.
Dollar rolls have generally been trading close to or below carry, so investors may be able to boost returns further using specified pools without sacrificing returns from dollar rolls.
Clear relative value
Investors still able to trade for relative value can add MBS at historically wide spreads, with liquidity second only to the Treasury market and with potential to deliver significantly better returns than Treasury debt. Higher coupon Ginnie Mae MBS are projected to have the highest returns relative to Treasury debt. The relative value is clear.
An appendix to this note shows all the calculations used in estimating returns in 30-year pass-through and in the matched portfolios of Treasury debt.
Brian Landy
1 (646) 776-7795
blandy@apsec.com
APPENDIX
FNCL 2.0%s
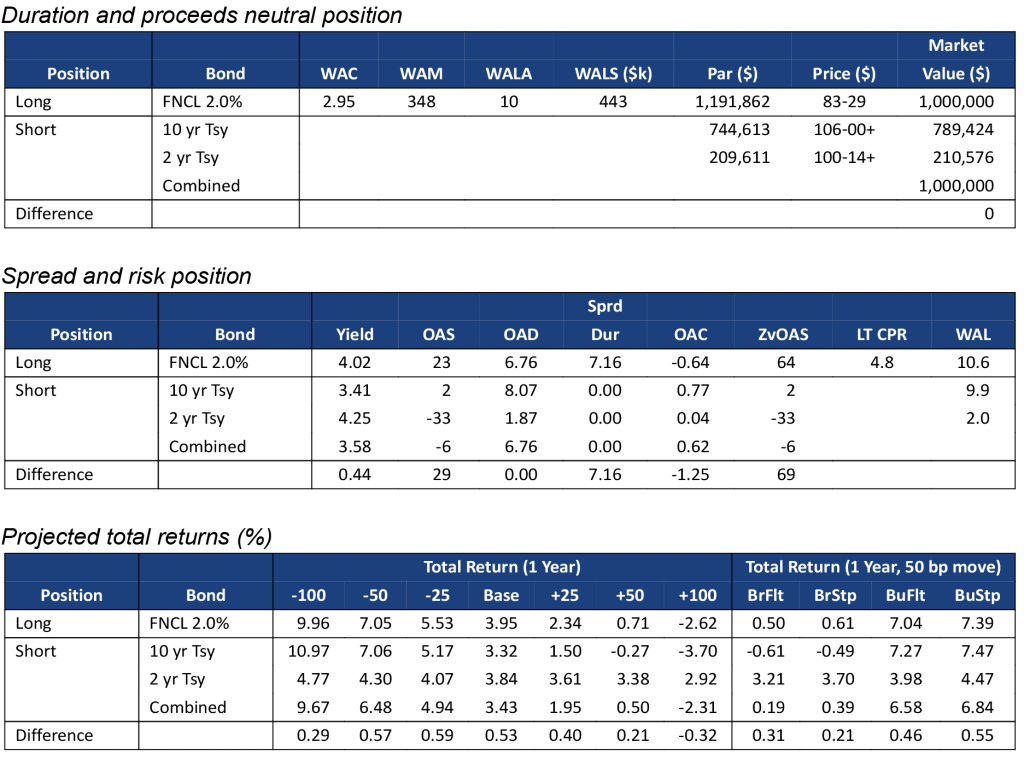
Note: All market levels as of COB 12/7/2022. Total returns assume a linear parallel shift in rates and constant OAS repricing at horizon, reinvestment in 1-month SOFR.
Source: Yield Book, Amherst Pierpont Securities.
FNCL 2.5%s
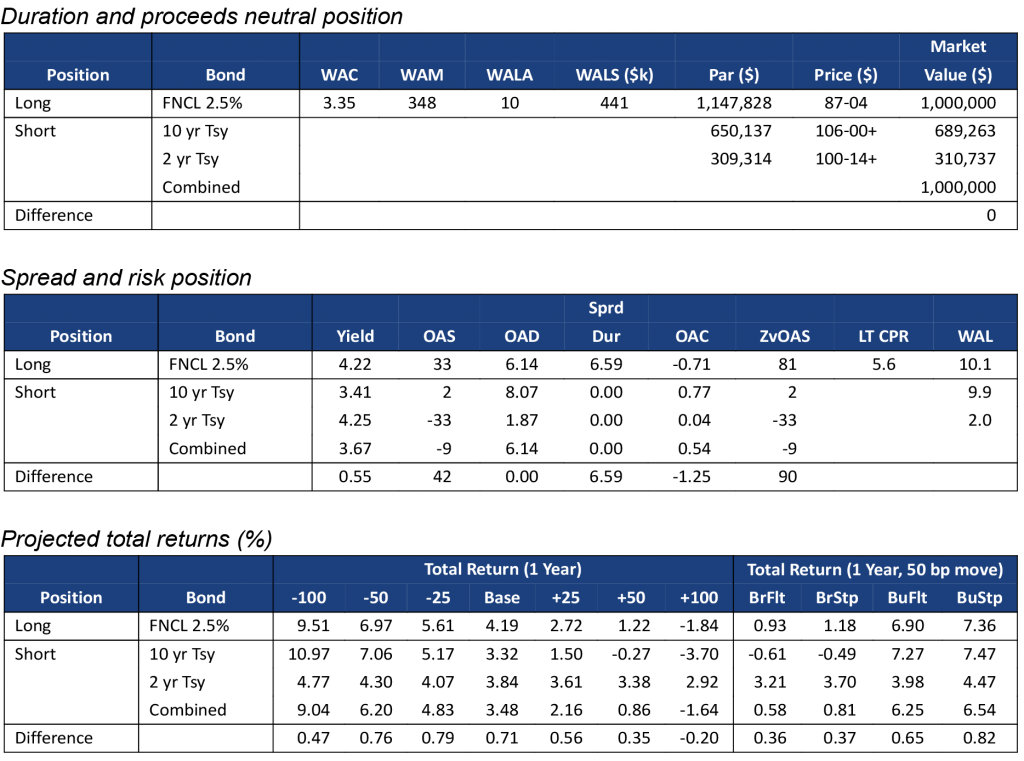
Note: All market levels as of COB 12/7/2022. Total returns assume a linear parallel shift in rates and constant OAS repricing at horizon, reinvestment in 1-month SOFR.
Source: Yield Book, Amherst Pierpont Securities.
FNCL 3.0%s
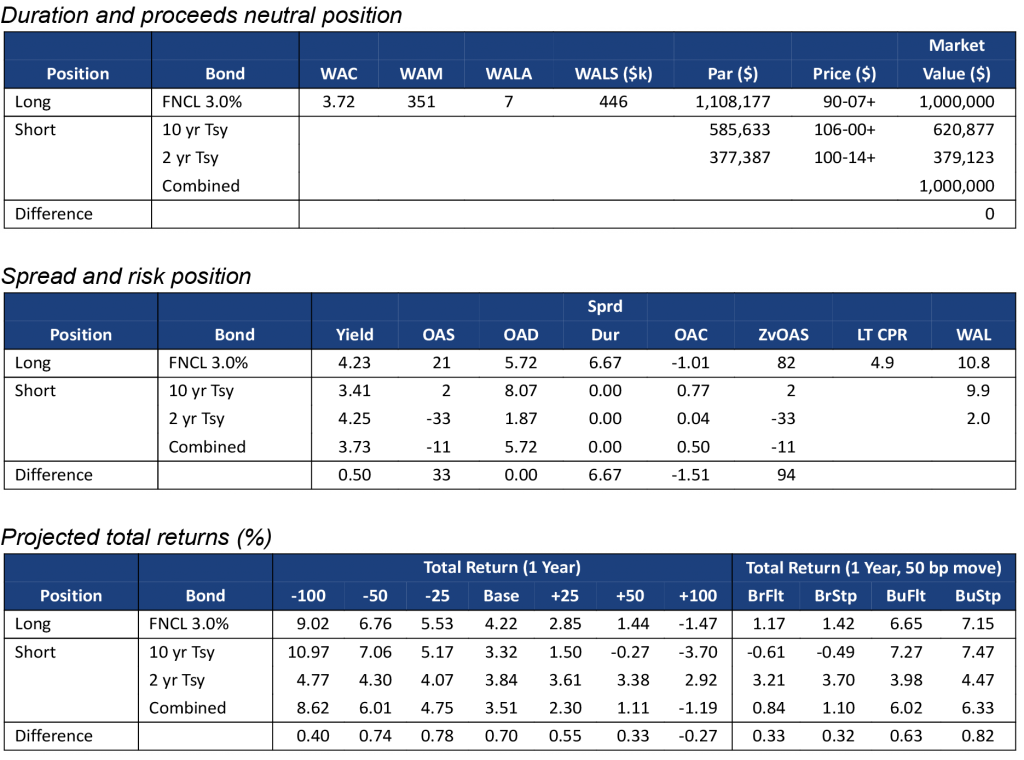
Note: All market levels as of COB 12/7/2022. Total returns assume a linear parallel shift in rates and constant OAS repricing at horizon, reinvestment in 1-month SOFR.
Source: Yield Book, Amherst Pierpont Securities.
FNCL 3.5%s

Note: All market levels as of COB 12/7/2022. Total returns assume a linear parallel shift in rates and constant OAS repricing at horizon, reinvestment in 1-month SOFR.
Source: Yield Book, Amherst Pierpont Securities.
FNCL 4.0%s
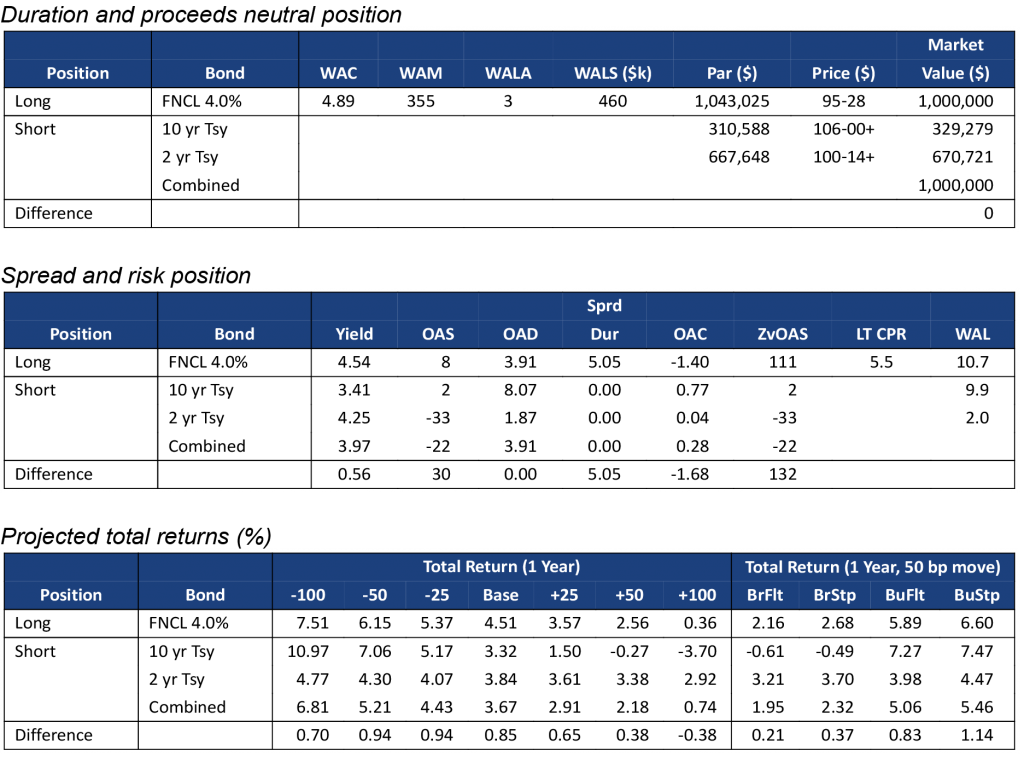
Note: All market levels as of COB 12/7/2022. Total returns assume a linear parallel shift in rates and constant OAS repricing at horizon, reinvestment in 1-month SOFR.
Source: Yield Book, Amherst Pierpont Securities.
FNCL 4.5%s
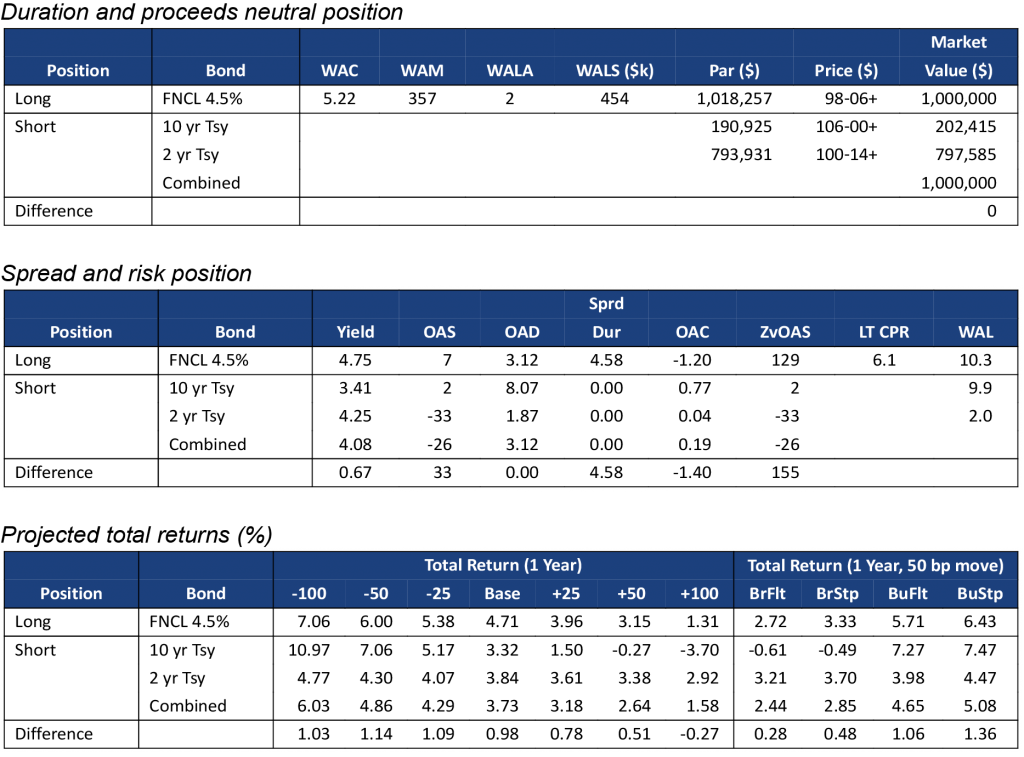
Note: All market levels as of COB 12/7/2022. Total returns assume a linear parallel shift in rates and constant OAS repricing at horizon, reinvestment in 1-month SOFR. Source: Yield Book, Amherst Pierpont Securities.
FNCL 5.0%s
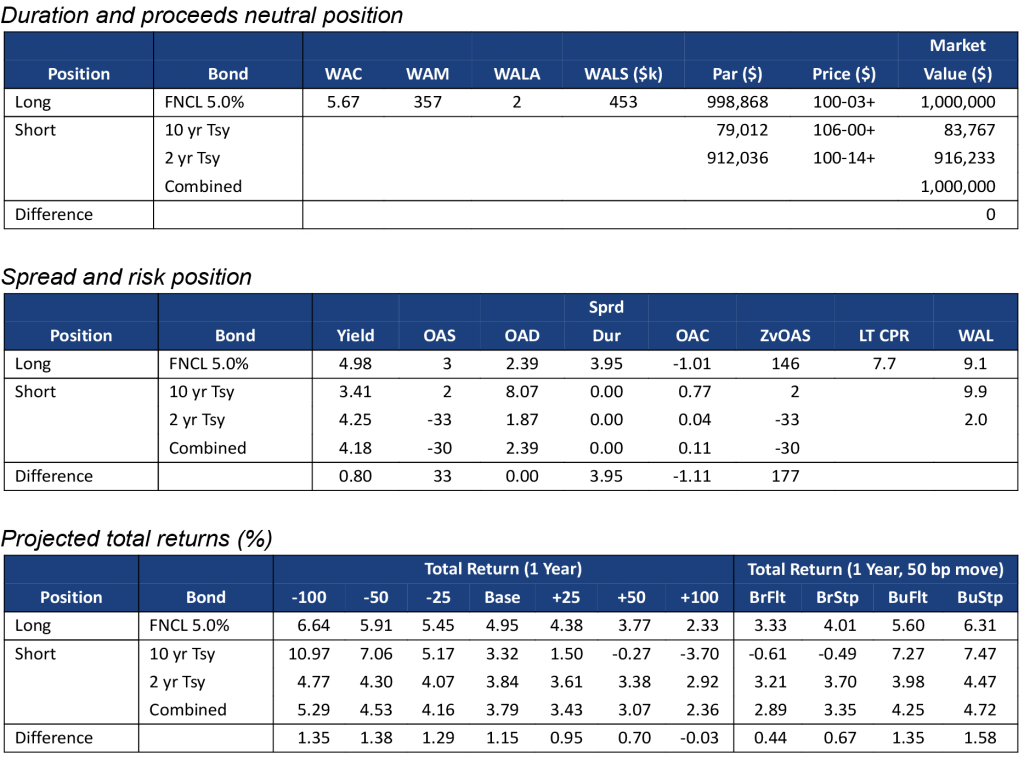
Note: All market levels as of COB 12/7/2022. Total returns assume a linear parallel shift in rates and constant OAS repricing at horizon, reinvestment in 1-month SOFR.
Source: Yield Book, Amherst Pierpont Securities.
FNCL 5.5%s
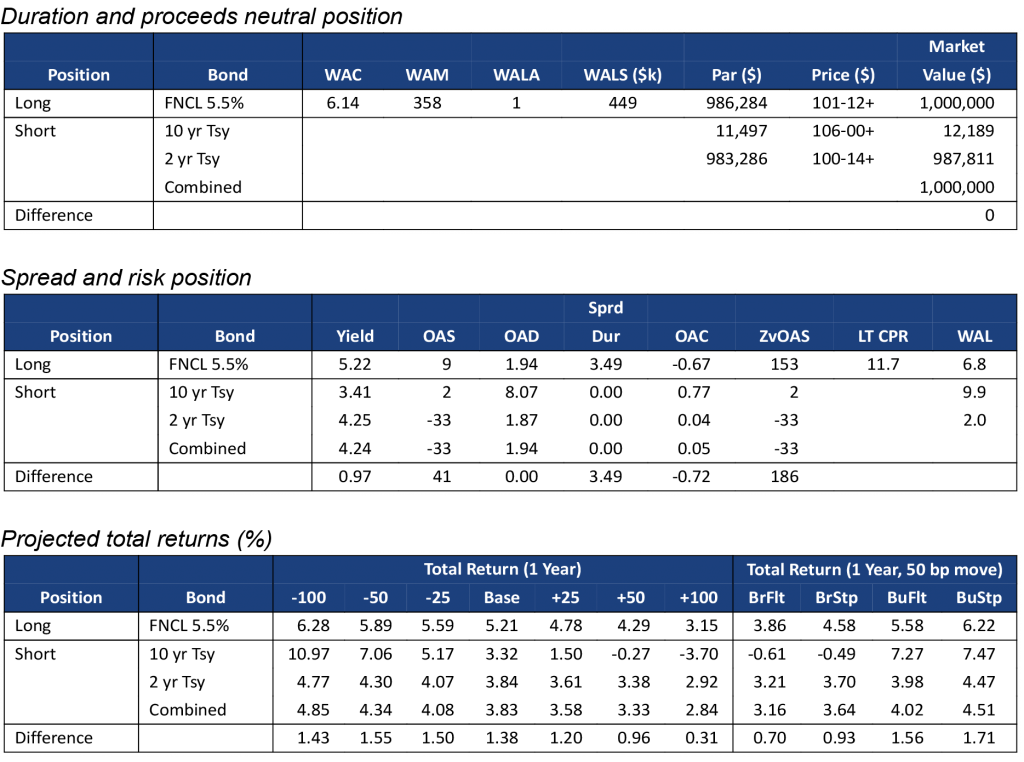
Note: All market levels as of COB 12/7/2022. Total returns assume a linear parallel shift in rates and constant OAS repricing at horizon, reinvestment in 1-month SOFR. Source: Yield Book, Amherst Pierpont Securities.
G2SF 2.0%s
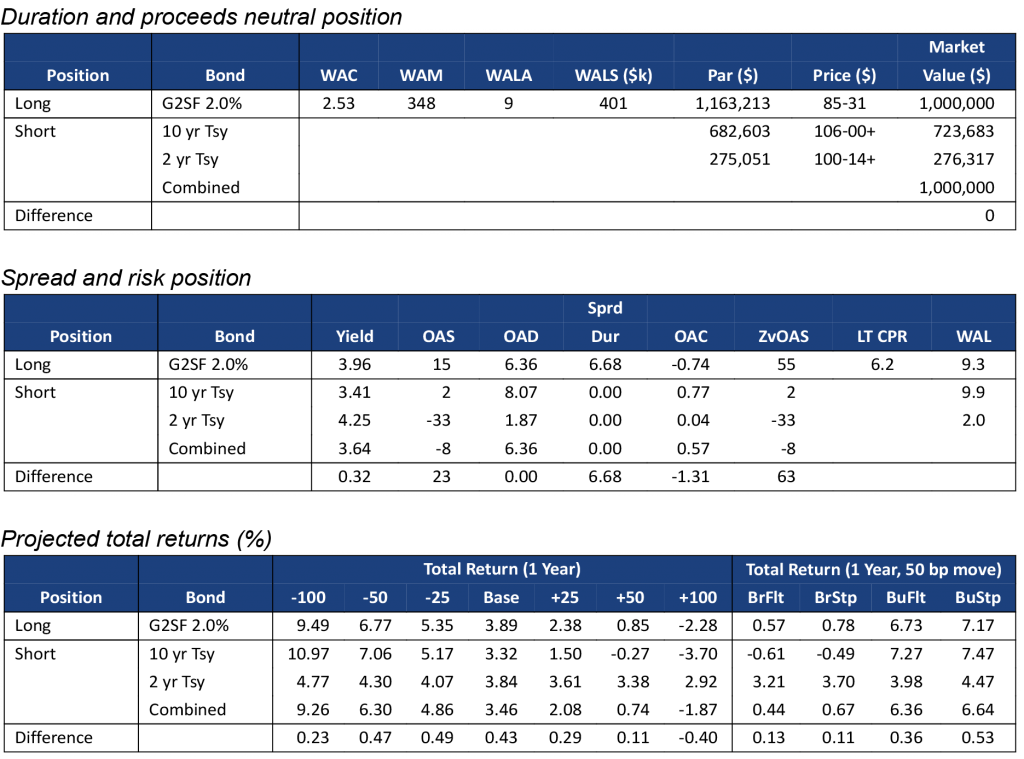
Note: All market levels as of COB 12/7/2022. Total returns assume a linear parallel shift in rates and constant OAS repricing at horizon, reinvestment in 1-month SOFR.
Source: Yield Book, Amherst Pierpont Securities.
G2SF 2.5%s
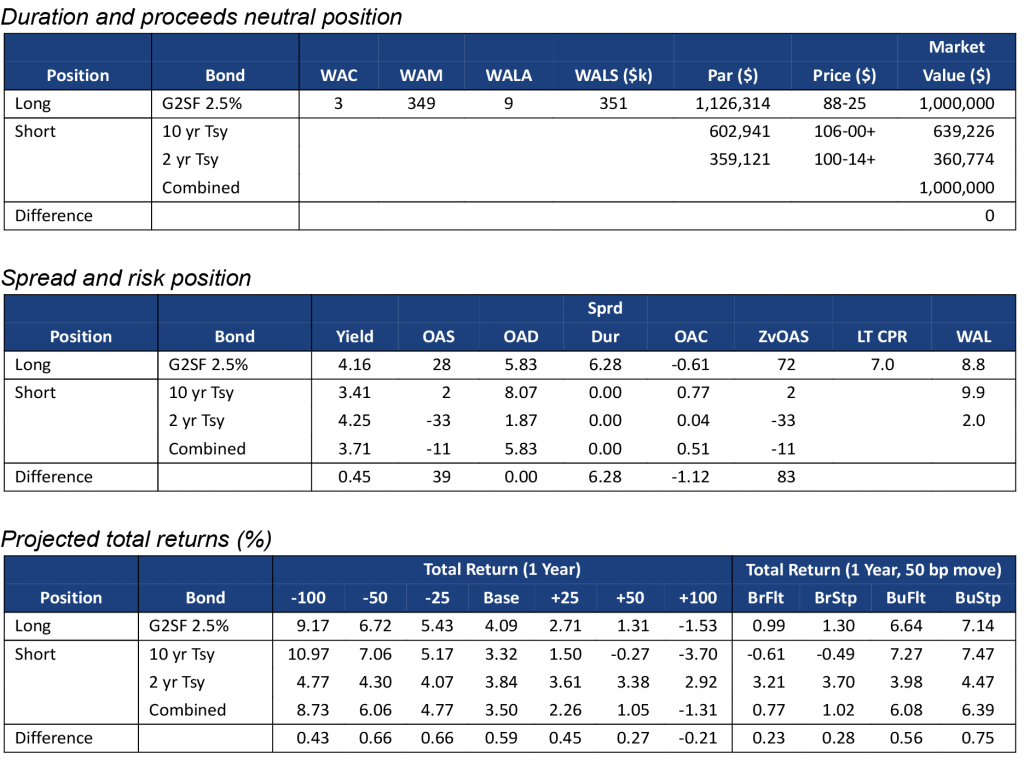
Note: All market levels as of COB 12/7/2022. Total returns assume a linear parallel shift in rates and constant OAS repricing at horizon, reinvestment in 1-month SOFR. Source: Yield Book, Amherst Pierpont Securities.
G2SF 3.0%s
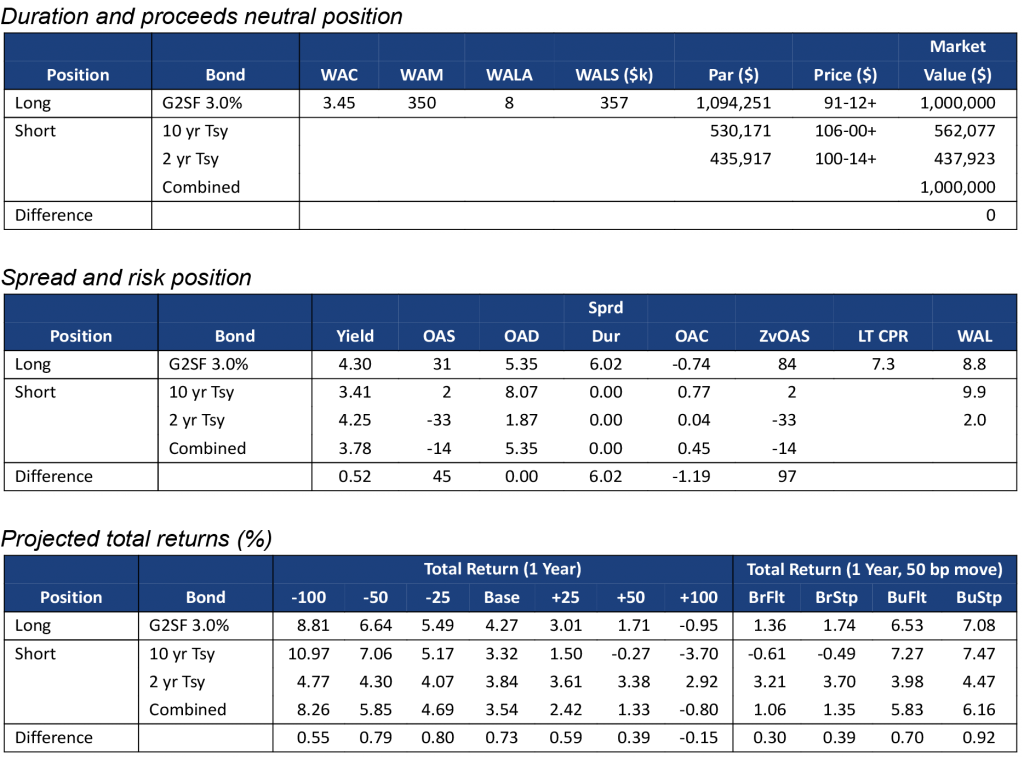
Note: All market levels as of COB 12/7/2022. Total returns assume a linear parallel shift in rates and constant OAS repricing at horizon, reinvestment in 1-month SOFR.
Source: Yield Book, Amherst Pierpont Securities.
G2SF 3.5%s
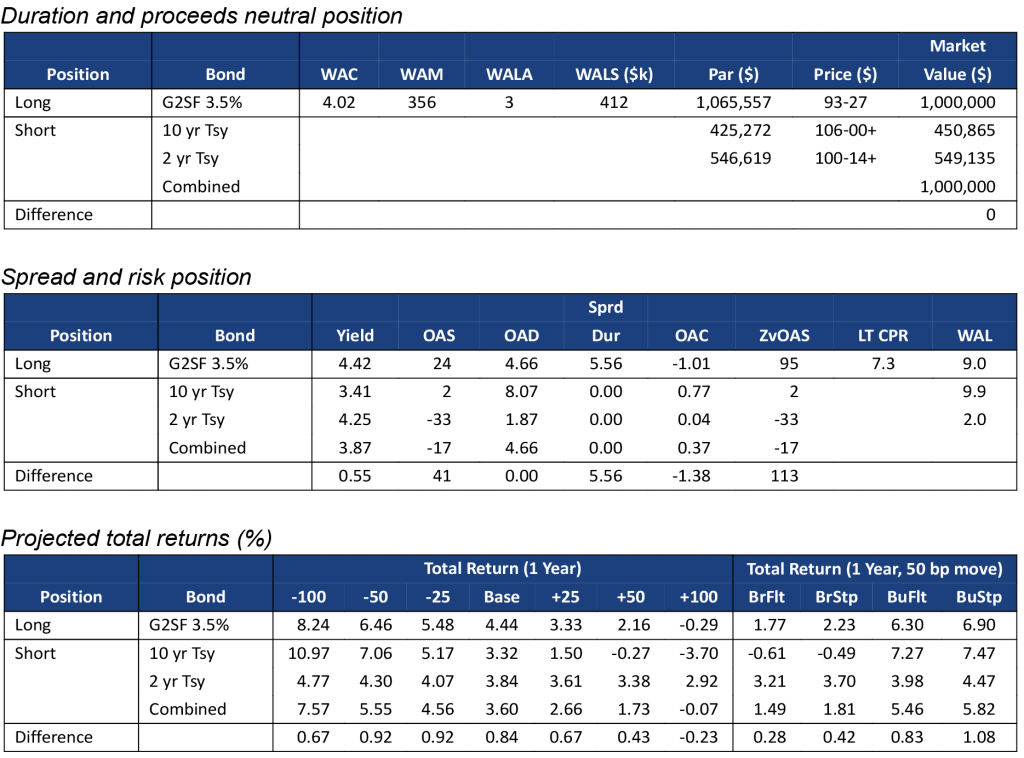
Note: All market levels as of COB 12/7/2022. Total returns assume a linear parallel shift in rates and constant OAS repricing at horizon, reinvestment in 1-month SOFR.
Source: Yield Book, Amherst Pierpont Securities.
G2SF 4.0%s
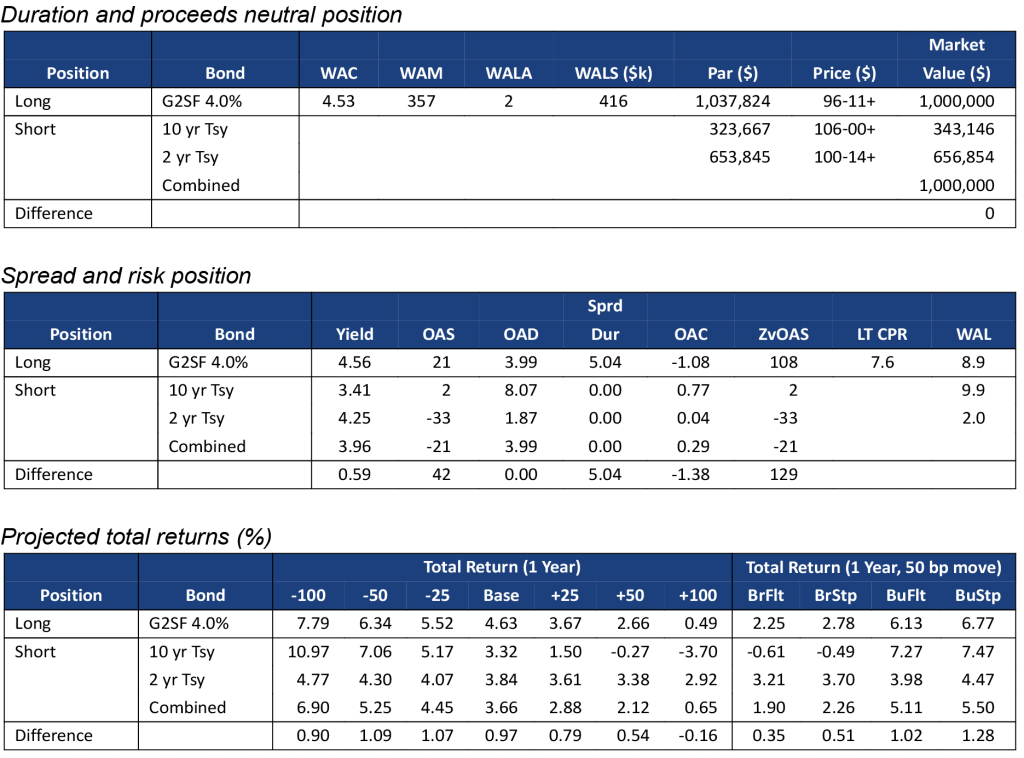
Note: All market levels as of COB 12/7/2022. Total returns assume a linear parallel shift in rates and constant OAS repricing at horizon, reinvestment in 1-month SOFR. Source: Yield Book, Amherst Pierpont Securities.
G2SF 4.5%s
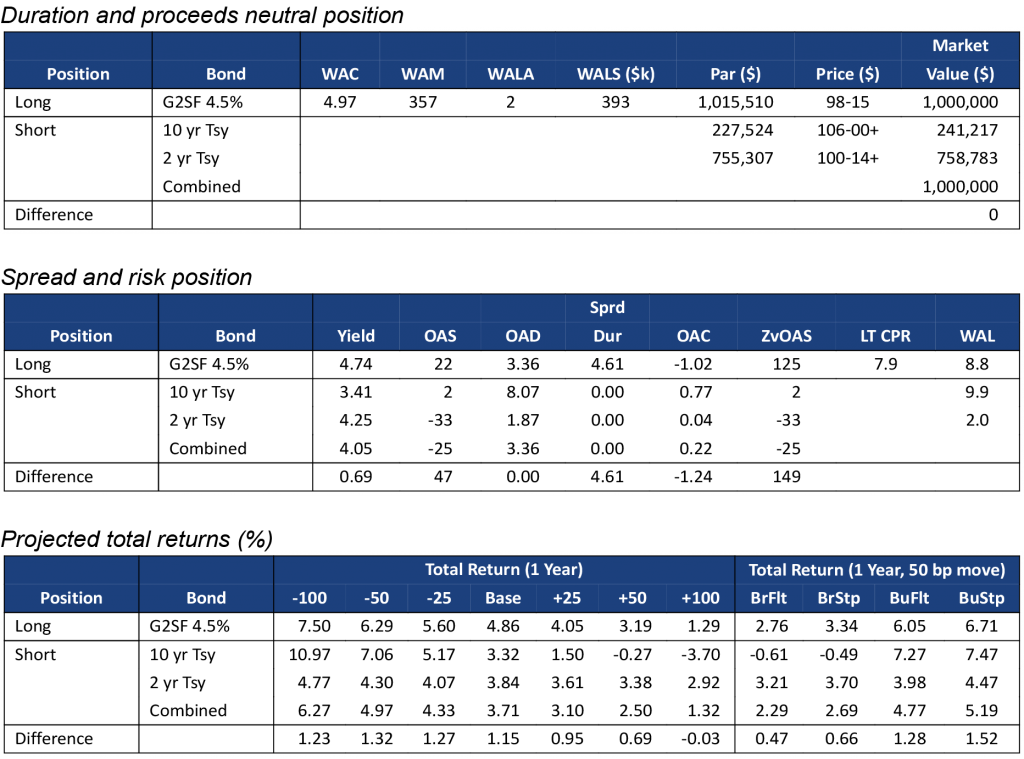
Note: All market levels as of COB 12/7/2022. Total returns assume a linear parallel shift in rates and constant OAS repricing at horizon, reinvestment in 1-month SOFR.
Source: Yield Book, Amherst Pierpont Securities.
G2SF 5.0%s
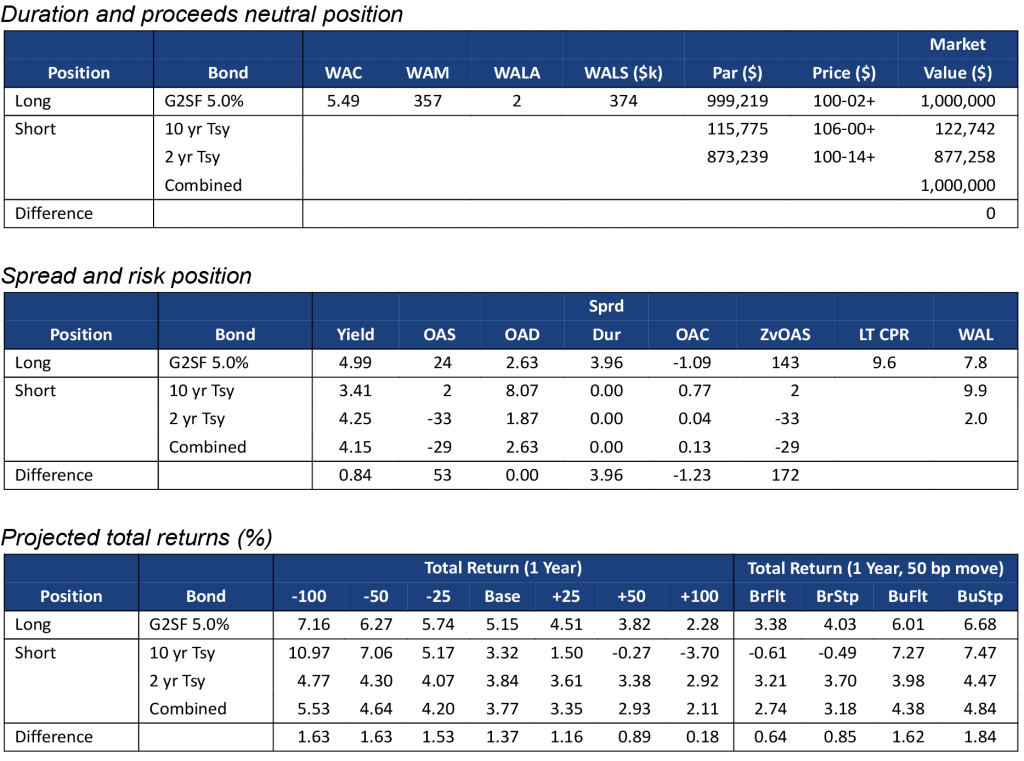
Note: All market levels as of COB 12/7/2022. Total returns assume a linear parallel shift in rates and constant OAS repricing at horizon, reinvestment in 1-month SOFR. Source: Yield Book, Amherst Pierpont Securities.
G2SF 5.5%s
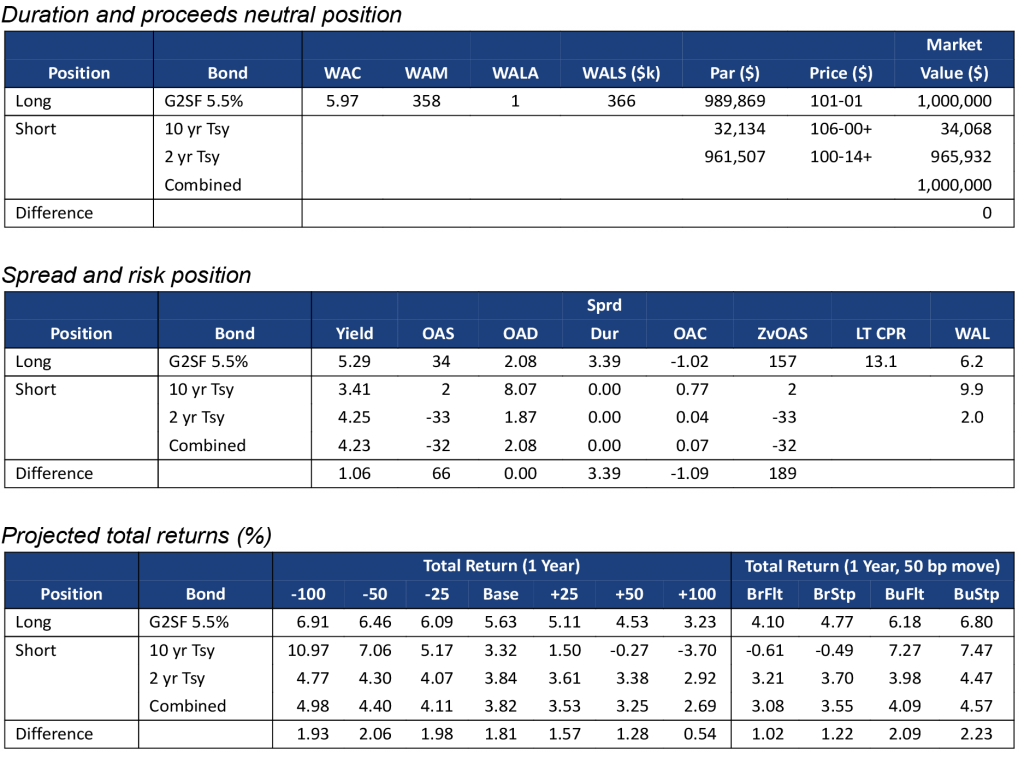
Note: All market levels as of COB 12/7/2022. Total returns assume a linear parallel shift in rates and constant OAS repricing at horizon, reinvestment in 1-month SOFR.
Source: Yield Book, Amherst Pierpont Securities.