By the Numbers
Prepayment protection in 0% VA pools
This material is a Marketing Communication and does not constitute Independent Investment Research.
Loans guaranteed by the Veterans Administration are known to prepay much faster than other government-insured loans, and custom Ginnie Mae pools that exclude VA loans can offer significant protection against prepayment risk. Ginnie Mae multi-issuer pools with lower coupons are dominated by VA loans since VA borrowers typically receive lower interest rates than other borrowers. Most G2SF 2.0% pools contain around 80% VA. But the market is currently offering 0% VA pools with very little pay-up. They appear to be one of the market’s most inexpensive sources of prepayment protection.
A review of prepayment speeds during the most recent refinancing wave illustrates that VA loans continued to prepay much faster than FHA loans (Exhibit 1). The pattern is clear in S-curves for FHA and VA loans delivered into multi-issuer pools with between six months and 36 months of seasoning from March through December 2020. The average S-curve for all loans in the multi-pool is included as well. The S-curve includes only voluntary prepayments and excludes buyouts to eliminate distortions from the large bank buyouts last summer. Only FHA loans greater than $225,000 original loan size are included in the FHA-only S-curve, since smaller loans ought to be sold into low loan balance pools. This paints a more conservative view of what a 0% VA pool would look like. However, many of these loans have been sold into the multi pools.
Exhibit 1: VA loans prepaid much faster than FHA loans during the pandemic
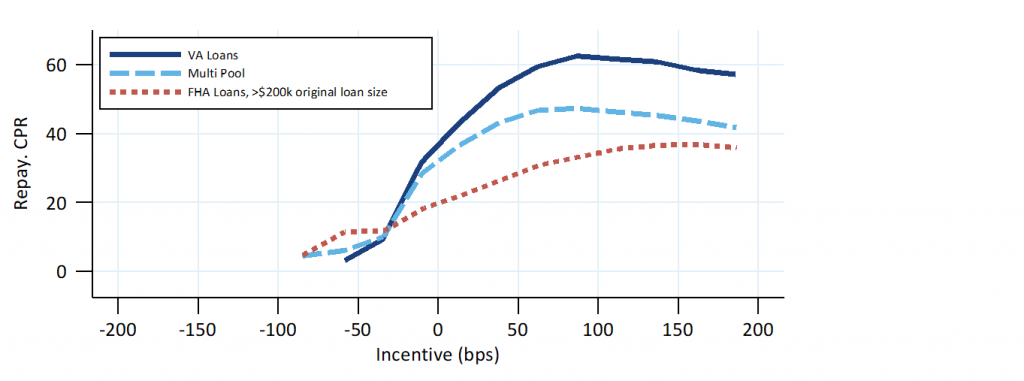
Performance from March 2020 through December 2020. Only loans sold into multi pools are included, with WALA between 6 and 36 months. Rate incentive is measured versus the Freddie Mac Primary Mortgage Market Survey rate.
Source: Ginnie Mae, eMBS, Amherst Pierpont Securities
The multi pool S-curve, however, is not indicative of how a specific multi pool will prepay. Prepayment rates on pools with lower refinancing incentives come from lower coupon pools with heavier VA concentrations, while the higher incentives come from higher coupon pools with lower VA concentrations. This causes the multi-pool S-curve to converge towards the FHA S-curve at higher incentives.
An investor buying a multi pool will get one with a specific VA concentration. Most 2.0% pools are roughly 80% VA, while most outstanding 2.5% pools are 50% to 70% VA. Investors should assume the G2SF 2.0% TBA is 80% VA and the 2.5% TBA is 70% VA. Similarly, most outstanding 3.0% multi pools are 40% to 50% VA, so investors should assume 50% VA for the TBA.
Prepayment differences between a likely multi pool stand out in a picture showing the same FHA and VA S-curves and a blended S-curve assuming 80% VA, which is a proxy for the 2.0% TBA pool (Exhibit 2). The blended S-curve eliminates most of the skew across rate incentives seen in the previous chart due to the changing VA share. The FHA loans should refinance 40% slower than the multi pool; illustrated by the red dotted line where the refi response is dialed down to 40% of the blue baseline. The high VA concentration suggests that the 2.0% TBA would have extremely fast speeds if interest rates were to drop.
Exhibit 2: A 2.0% pool with no VA loans should refinance 40% slower than TBA.
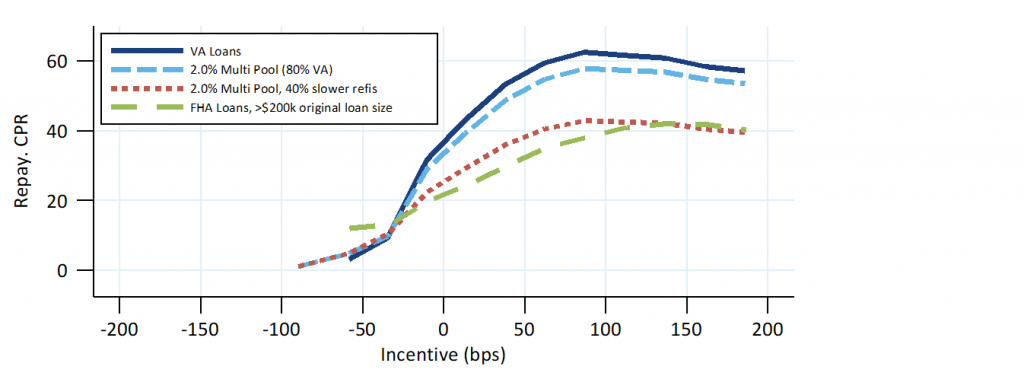
Source: Ginnie Mae, eMBS, Amherst Pierpont Securities
The dialed S-curve meets the FHA loans at the highest incentive but is still somewhat faster than FHA at lower incentives. This is because the VA loans tend to be a higher loan size at those incentives. The multiplier was chosen to give a more conservative view of the speed benefit of the FHA loans.
Similarly, the 2.5% TBA is modeled using a 70% VA share (Exhibit 3). This TBA should also exhibit significant negative convexity, and a 0% VA pool should refinance 35% slower than the TBA.
Exhibit 3: A 2.5% pool with no VA loans should refinance 35% slower than TBA.
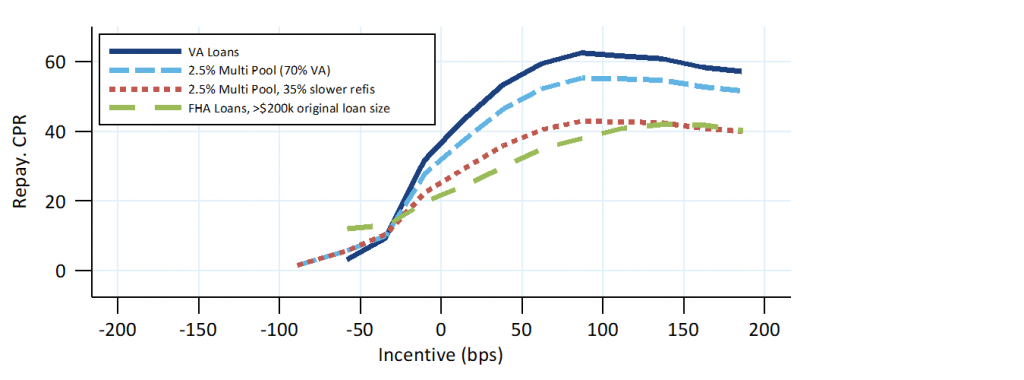
Source: Ginnie Mae, eMBS, Amherst Pierpont Securities
Similarly, the 3.0% TBA is modeled using a 50% VA share (Exhibit 4). This places the TBA S-curve halfway between the FHA and VA S-curves, and a 0% VA pool should refinance 30% slower than the TBA.
Exhibit 4: A 3.0% pool with no VA loans should refinance 30% slower than TBA.
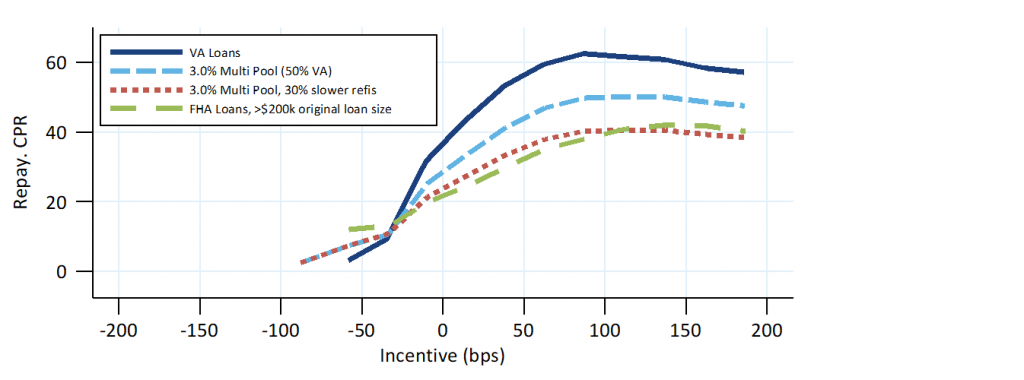
Source: Ginnie Mae, eMBS, Amherst Pierpont Securities
Valuations
The theoretical pay-ups implied by these speed differences is substantial. Pay-ups are calculated by running a recent production multi pool from each coupon through Yield Book at the TBA price to get an OAS. The multi pool is used as a proxy for TBA; these OASs are much lower than Yield Book’s TBA OASs, which suggests these are more representative than Yield Book’s assumption of what might be delivered into a TBA contract. Each bond is run a second time at the TBA OAS, through a version of the model dialed to have slower refinance speeds expected of a 0% VA pool. The price difference is the theoretical pay-up.
Exhibit 5: Theoretical pay-ups range from $1-18+ to $2-20+ yet very few pools are being made
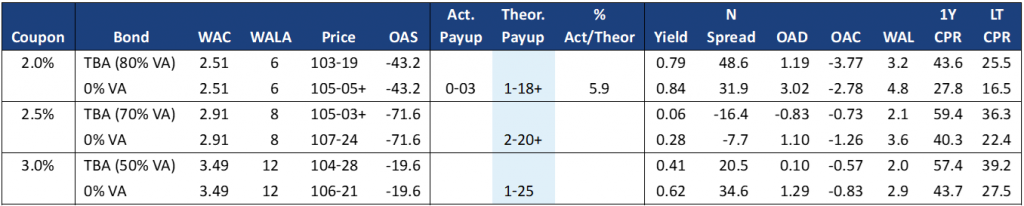
Source: Ginnie Mae, eMBS, Amherst Pierpont Securities
The largest pay-up is $2-20+ for a 0% VA 2.5% pool. But there has been almost no production or trading of these pools in this coupon. There were some recent trades in the 2.0% coupon, with pay-ups averaging 3/32s. That is far below the theoretical pay-up of $1-18+. The 2.5% coupon benefits the most since it is projected to have extremely fast prepayment speeds and also has an extremely high VA share.
Investors might be concerned about the buyout risk posed by FHA loans, which could lower the pay-up. But this risk should be much lower in new production pools since the loans were originated well after the onset of the pandemic. Of course, the economy could weaken and raise buyout risk. Another consideration is the Ginnie Mae rolls in these coupons are trading special, as are the UMBS rolls in 2.0%s and 2.5%s. But these pay-ups are much higher than the carry advantage in the roll, so the roll would need to remain special for a long time to erode the pay-up. Finally, 0% VA pools come out through the Ginnie Mae custom program and are not eligible for TBA delivery, lowering their liquidity and likely showing up in lower marks from pricing services. Nevertheless, portfolios able to bear the liquidity difference a pricing risk should still see value in the fundamentally more stable likely cash flows of 0% VA pools.
This material is intended only for institutional investors and does not carry all of the independence and disclosure standards of retail debt research reports. In the preparation of this material, the author may have consulted or otherwise discussed the matters referenced herein with one or more of SCM’s trading desks, any of which may have accumulated or otherwise taken a position, long or short, in any of the financial instruments discussed in or related to this material. Further, SCM may act as a market maker or principal dealer and may have proprietary interests that differ or conflict with the recipient hereof, in connection with any financial instrument discussed in or related to this material.
This message, including any attachments or links contained herein, is subject to important disclaimers, conditions, and disclosures regarding Electronic Communications, which you can find at https://portfolio-strategy.apsec.com/sancap-disclaimers-and-disclosures.
Important Disclaimers
Copyright © 2026 Santander US Capital Markets LLC and its affiliates (“SCM”). All rights reserved. SCM is a member of FINRA and SIPC. This material is intended for limited distribution to institutions only and is not publicly available. Any unauthorized use or disclosure is prohibited.
In making this material available, SCM (i) is not providing any advice to the recipient, including, without limitation, any advice as to investment, legal, accounting, tax and financial matters, (ii) is not acting as an advisor or fiduciary in respect of the recipient, (iii) is not making any predictions or projections and (iv) intends that any recipient to which SCM has provided this material is an “institutional investor” (as defined under applicable law and regulation, including FINRA Rule 4512 and that this material will not be disseminated, in whole or part, to any third party by the recipient.
The author of this material is an economist, desk strategist or trader. In the preparation of this material, the author may have consulted or otherwise discussed the matters referenced herein with one or more of SCM’s trading desks, any of which may have accumulated or otherwise taken a position, long or short, in any of the financial instruments discussed in or related to this material. Further, SCM or any of its affiliates may act as a market maker or principal dealer and may have proprietary interests that differ or conflict with the recipient hereof, in connection with any financial instrument discussed in or related to this material.
This material (i) has been prepared for information purposes only and does not constitute a solicitation or an offer to buy or sell any securities, related investments or other financial instruments, (ii) is neither research, a “research report” as commonly understood under the securities laws and regulations promulgated thereunder nor the product of a research department, (iii) or parts thereof may have been obtained from various sources, the reliability of which has not been verified and cannot be guaranteed by SCM, (iv) should not be reproduced or disclosed to any other person, without SCM’s prior consent and (v) is not intended for distribution in any jurisdiction in which its distribution would be prohibited.
In connection with this material, SCM (i) makes no representation or warranties as to the appropriateness or reliance for use in any transaction or as to the permissibility or legality of any financial instrument in any jurisdiction, (ii) believes the information in this material to be reliable, has not independently verified such information and makes no representation, express or implied, with regard to the accuracy or completeness of such information, (iii) accepts no responsibility or liability as to any reliance placed, or investment decision made, on the basis of such information by the recipient and (iv) does not undertake, and disclaims any duty to undertake, to update or to revise the information contained in this material.
Unless otherwise stated, the views, opinions, forecasts, valuations, or estimates contained in this material are those solely of the author, as of the date of publication of this material, and are subject to change without notice. The recipient of this material should make an independent evaluation of this information and make such other investigations as the recipient considers necessary (including obtaining independent financial advice), before transacting in any financial market or instrument discussed in or related to this material.
Important disclaimers for clients in the EU and UK
This publication has been prepared by Trading Desk Strategists within the Sales and Trading functions of Santander US Capital Markets LLC (“SanCap”), the US registered broker-dealer of Santander Corporate & Investment Banking. This communication is distributed in the EEA by Banco Santander S.A., a credit institution registered in Spain and authorised and regulated by the Bank of Spain and the CNMV. Any EEA recipient of this communication that would like to affect any transaction in any security or issuer discussed herein should do so with Banco Santander S.A. or any of its affiliates (together “Santander”). This communication has been distributed in the UK by Banco Santander, S.A.’s London branch, authorised by the Bank of Spain and subject to regulatory oversight on certain matters by the Financial Conduct Authority (FCA) and the Prudential Regulation Authority (PRA).
The publication is intended for exclusive use for Professional Clients and Eligible Counterparties as defined by MiFID II and is not intended for use by retail customers or for any persons or entities in any jurisdictions or country where such distribution or use would be contrary to local law or regulation.
This material is not a product of Santander´s Research Team and does not constitute independent investment research. This is a marketing communication and may contain ¨investment recommendations¨ as defined by the Market Abuse Regulation 596/2014 ("MAR"). This publication has not been prepared in accordance with legal requirements designed to promote the independence of research and is not subject to any prohibition on dealing ahead of the dissemination of investment research. The author, date and time of the production of this publication are as indicated herein.
This publication does not constitute investment advice and may not be relied upon to form an investment decision, nor should it be construed as any offer to sell or issue or invitation to purchase, acquire or subscribe for any instruments referred herein. The publication has been prepared in good faith and based on information Santander considers reliable as of the date of publication, but Santander does not guarantee or represent, express or implied, that such information is accurate or complete. All estimates, forecasts and opinions are current as at the date of this publication and are subject to change without notice. Unless otherwise indicated, Santander does not intend to update this publication. The views and commentary in this publication may not be objective or independent of the interests of the Trading and Sales functions of Santander, who may be active participants in the markets, investments or strategies referred to herein and/or may receive compensation from investment banking and non-investment banking services from entities mentioned herein. Santander may trade as principal, make a market or hold positions in instruments (or related derivatives) and/or hold financial interest in entities discussed herein. Santander may provide market commentary or trading strategies to other clients or engage in transactions which may differ from views expressed herein. Santander may have acted upon the contents of this publication prior to you having received it.
This publication is intended for the exclusive use of the recipient and must not be reproduced, redistributed or transmitted, in whole or in part, without Santander’s consent. The recipient agrees to keep confidential at all times information contained herein.


