Uncategorized
Forebearance pays off in seasoned RPLs
admin | October 4, 2019
This material is a Marketing Communication and does not constitute Independent Investment Research.
Investors in seasoned RPL transactions are subject to somewhat of a unique risk in that non-performing loan balances commonly account for some of the securitized principal. The good news to date is that investors have received nearly 90% of this forborne principal on loans that have left the trust. But recoveries have been far from uniform, and some trusts have recovered significantly more principal than others.
Tracking forbearance recoveries
Seasoned re-performing securitizations differ from most traditional private deals in that not all of the principal balance is performing at deal time. The non-performing balances will vary deal to deal, ranging anywhere from zero to almost 15% of some deals. Depending on the amount of forbearance securitized, some or all of the deep subordinate certificates will be levered plays on forbearance recoveries. While these tranches are by and large retained by the issuer, any shortfall in forbearance recoveries will erode credit enhancement, potentially hurting prices on more senior bonds. Trusts with larger amounts of securitized forbearance have by and large prepaid much slower than those with small amounts. As a result, these deals de-leverage slower and losses associated with forbearance recovery shortfalls may have an outsized impact on overall credit enhancement.
Exhibit 1: Forbearance exposure across RPL trusts
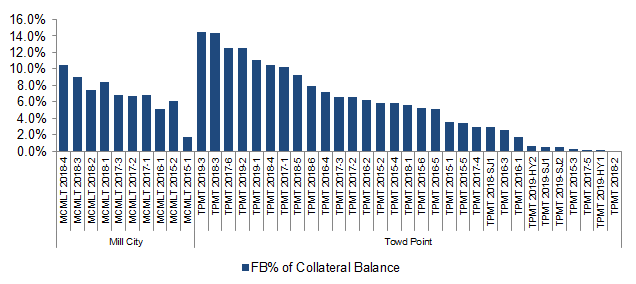
Note: As of August 25, 2019 remittance. Source: Intex, Amherst Pierpont Securities
To date over 3,200 loans with forbearance have left RPL trusts either through prepayment or liquidation across two shelves analyzed, CarVal’s Mill City (MCMLT) and Towd Point’s (TPMT) shelf. Loans with forbearance that have left RPL trusts have totaled over $700 million with roughly $90 million of that being forborne principal. Over $80 million of that non-performing principal has been recovered. Elevated forbearance recoveries appear to primarily be a function of relatively small amounts of forbearance relative to the total principal balance and low mark-to-market LTVs, similar to what we observe in legacy deals.
Loans with forbearance that have left RPL trusts have had an average of 14% in non-performing balance and a mark-to-market LTV of 64. Low LTVs have likely driven prepayments on loans that prepay as borrowers turn over and capture pent up equity or refinance as their credit cures post-modification. On loans that that have ultimately defaulted and liquidated low mark-to-market LTVs have provided adequate cushion to recover both performing and non-performing principal balances. One additional tailwind to higher forbearance recoveries in RPL transactions relative to legacy deals is that while servicers are required to advance applicable taxes and insurance on delinquent and defaulted loans, they do not advance principal and interest that would be recouped at point of liquidation, leaving more liquidated principal to be recovered by the trust and investors.
While average amounts of forbearance and LTVs on loans that abated were low, they varied somewhat significantly. Across trusts analyzed, average trust level forbearance amounts ranged from 2% to 26% of abated balances. And trust level LTVs on abated loans with forbearance ranged from as low as 36 to upwards of 85. Given this variance, trust level forbearance recoveries have ranged from zero to 100% with an obvious skew towards higher recoveries.
The majority of loans with forbearance that have abated from RPL trusts have come from the Towd Point shelf totaling $581 million compared to more than $120 million coming from Mill City deals. Towd Point recoveries have on average been 30 points higher than those experienced in the Mill City shelf to date, totaling 93% and 63% respectively. Somewhat surprisingly, Towd Point recoveries have been higher despite, albeit modestly, larger amounts of forborne principal and higher mark-to-market LTVs. On average, loans with forbearance that have left Towd Point trusts have had 16% in forborne principal and a mark-to-market LTV of roughly 65, while loans in the Mill City shelf have had 10% forbearance and a 63 LTV. (Exhibit 2) Additionally, Towd Point trusts with the largest amounts of securitized forbearance have some of the highest recovery rates. TPMT 2018-3 and 2019-3 which both have upwards of 14% non-performing principal balances have had 99% forbearance recoveries to date. A similar phenomenon is occurring in the Mill City program. The MCMLT 2018-3 and 2018-4 deals have 9.1% and 10.5% forbearance respectively. The 2018-3 deal has recovered 94% of forborne principal while the 2018-4 trust has recovered 100%.
Exhibit 2: Forbearance recoveries by trust
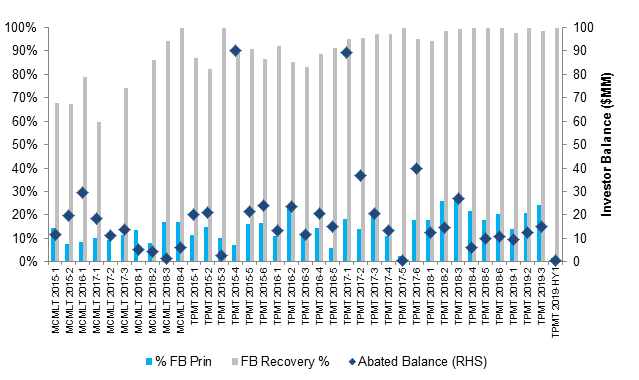
Source: Amherst Insight Labs, Amherst Pierpont Securities
One potential risk when observing these recoveries is that the servicer may not report a loss even in the event forbearance is not recovered. In an effort to mitigate any servicer reporting discrepancies, it is important to cross-reference abatements on loans with large amounts of forborne principal relative to the performing balance to see if the forbearance was being recovered. One example of this is a loan from the Towd Point 2017-3 trust that paid off in July of this year. The loan had a balance of $114,169 prior to termination, with $67,228 or roughly 59% of the balance non-performing. Per the August remittance, the trust recovered the entirety of the performing and non-performing balances, a nod towards the veracity of these elevated recoveries being realized.
This material is intended only for institutional investors and does not carry all of the independence and disclosure standards of retail debt research reports. In the preparation of this material, the author may have consulted or otherwise discussed the matters referenced herein with one or more of SCM’s trading desks, any of which may have accumulated or otherwise taken a position, long or short, in any of the financial instruments discussed in or related to this material. Further, SCM may act as a market maker or principal dealer and may have proprietary interests that differ or conflict with the recipient hereof, in connection with any financial instrument discussed in or related to this material.
This message, including any attachments or links contained herein, is subject to important disclaimers, conditions, and disclosures regarding Electronic Communications, which you can find at https://portfolio-strategy.apsec.com/sancap-disclaimers-and-disclosures.
Important Disclaimers
Copyright © 2026 Santander US Capital Markets LLC and its affiliates (“SCM”). All rights reserved. SCM is a member of FINRA and SIPC. This material is intended for limited distribution to institutions only and is not publicly available. Any unauthorized use or disclosure is prohibited.
In making this material available, SCM (i) is not providing any advice to the recipient, including, without limitation, any advice as to investment, legal, accounting, tax and financial matters, (ii) is not acting as an advisor or fiduciary in respect of the recipient, (iii) is not making any predictions or projections and (iv) intends that any recipient to which SCM has provided this material is an “institutional investor” (as defined under applicable law and regulation, including FINRA Rule 4512 and that this material will not be disseminated, in whole or part, to any third party by the recipient.
The author of this material is an economist, desk strategist or trader. In the preparation of this material, the author may have consulted or otherwise discussed the matters referenced herein with one or more of SCM’s trading desks, any of which may have accumulated or otherwise taken a position, long or short, in any of the financial instruments discussed in or related to this material. Further, SCM or any of its affiliates may act as a market maker or principal dealer and may have proprietary interests that differ or conflict with the recipient hereof, in connection with any financial instrument discussed in or related to this material.
This material (i) has been prepared for information purposes only and does not constitute a solicitation or an offer to buy or sell any securities, related investments or other financial instruments, (ii) is neither research, a “research report” as commonly understood under the securities laws and regulations promulgated thereunder nor the product of a research department, (iii) or parts thereof may have been obtained from various sources, the reliability of which has not been verified and cannot be guaranteed by SCM, (iv) should not be reproduced or disclosed to any other person, without SCM’s prior consent and (v) is not intended for distribution in any jurisdiction in which its distribution would be prohibited.
In connection with this material, SCM (i) makes no representation or warranties as to the appropriateness or reliance for use in any transaction or as to the permissibility or legality of any financial instrument in any jurisdiction, (ii) believes the information in this material to be reliable, has not independently verified such information and makes no representation, express or implied, with regard to the accuracy or completeness of such information, (iii) accepts no responsibility or liability as to any reliance placed, or investment decision made, on the basis of such information by the recipient and (iv) does not undertake, and disclaims any duty to undertake, to update or to revise the information contained in this material.
Unless otherwise stated, the views, opinions, forecasts, valuations, or estimates contained in this material are those solely of the author, as of the date of publication of this material, and are subject to change without notice. The recipient of this material should make an independent evaluation of this information and make such other investigations as the recipient considers necessary (including obtaining independent financial advice), before transacting in any financial market or instrument discussed in or related to this material.
Important disclaimers for clients in the EU and UK
This publication has been prepared by Trading Desk Strategists within the Sales and Trading functions of Santander US Capital Markets LLC (“SanCap”), the US registered broker-dealer of Santander Corporate & Investment Banking. This communication is distributed in the EEA by Banco Santander S.A., a credit institution registered in Spain and authorised and regulated by the Bank of Spain and the CNMV. Any EEA recipient of this communication that would like to affect any transaction in any security or issuer discussed herein should do so with Banco Santander S.A. or any of its affiliates (together “Santander”). This communication has been distributed in the UK by Banco Santander, S.A.’s London branch, authorised by the Bank of Spain and subject to regulatory oversight on certain matters by the Financial Conduct Authority (FCA) and the Prudential Regulation Authority (PRA).
The publication is intended for exclusive use for Professional Clients and Eligible Counterparties as defined by MiFID II and is not intended for use by retail customers or for any persons or entities in any jurisdictions or country where such distribution or use would be contrary to local law or regulation.
This material is not a product of Santander´s Research Team and does not constitute independent investment research. This is a marketing communication and may contain ¨investment recommendations¨ as defined by the Market Abuse Regulation 596/2014 ("MAR"). This publication has not been prepared in accordance with legal requirements designed to promote the independence of research and is not subject to any prohibition on dealing ahead of the dissemination of investment research. The author, date and time of the production of this publication are as indicated herein.
This publication does not constitute investment advice and may not be relied upon to form an investment decision, nor should it be construed as any offer to sell or issue or invitation to purchase, acquire or subscribe for any instruments referred herein. The publication has been prepared in good faith and based on information Santander considers reliable as of the date of publication, but Santander does not guarantee or represent, express or implied, that such information is accurate or complete. All estimates, forecasts and opinions are current as at the date of this publication and are subject to change without notice. Unless otherwise indicated, Santander does not intend to update this publication. The views and commentary in this publication may not be objective or independent of the interests of the Trading and Sales functions of Santander, who may be active participants in the markets, investments or strategies referred to herein and/or may receive compensation from investment banking and non-investment banking services from entities mentioned herein. Santander may trade as principal, make a market or hold positions in instruments (or related derivatives) and/or hold financial interest in entities discussed herein. Santander may provide market commentary or trading strategies to other clients or engage in transactions which may differ from views expressed herein. Santander may have acted upon the contents of this publication prior to you having received it.
This publication is intended for the exclusive use of the recipient and must not be reproduced, redistributed or transmitted, in whole or in part, without Santander’s consent. The recipient agrees to keep confidential at all times information contained herein.